Your cells, sorted and named.
Send us your 10x Genomics data. Get back clusters, marker genes, suggested cell types and a report you can read without writing a line of code.
You do the biology. We do the computing.
Most single-cell tools assume you can program. CellPatri doesn't. You upload a file through a private portal and get answers you can take to your lab meeting.
What you send
- Cell Ranger output:
filtered_feature_bc_matrix.h5, or the matrix folder as a .zip - An AnnData
.h5adfile with raw counts - FASTQ files, if you haven't aligned yet (we run Cell Ranger for you)
- A few lines about the tissue, species and what you want to learn
What you get back
- A plain-language report with every figure explained
- Quality control: which cells were removed, and why
- Clusters on a UMAP map, with suggested cell types
- Marker genes for every cluster, as a spreadsheet
- A methods paragraph ready for your paper
- The processed
.h5adfile, for CELLxGENE, Scanpy or Seurat
How it works
-
Tell us about your experiment
Fill in the short form. We reply within one working day with a quote and set up your portal account.
-
Upload in the portal
Drag your file into the browser. Large files upload in pieces, so a dropped connection doesn't mean starting again.
-
Read your report
Standard analyses finish in about an hour. You'll see progress live and can download everything when it's done.
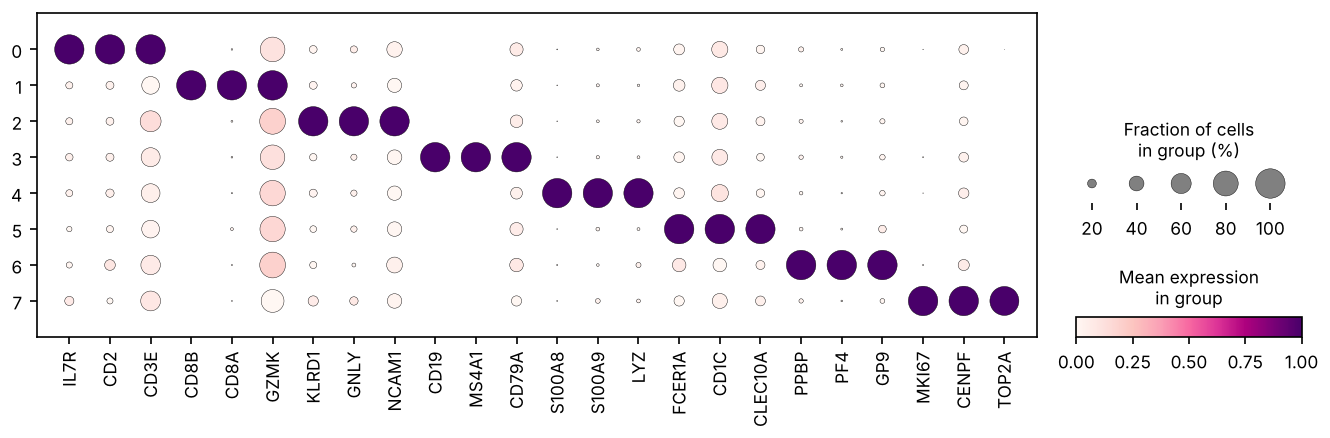
Inside every report
- Cell quality
- How many cells passed, how many were empty droplets, damaged cells or doublets, and the thresholds we used.
- The map of your cells
- A UMAP coloured by cluster, with a note on what distances do and don't mean.
- Suggested cell types
- A first-pass label for each cluster from well-known markers, clearly marked as a starting point for your own judgement.
- Marker genes
- The genes that set each cluster apart, with statistics, in a spreadsheet you can filter.
- Methods for your paper
- Software versions and every parameter, written up as a paragraph.
Your unpublished data stays yours
We know these datasets are years of work. The portal is built so that only you can see your files.
Private by design
Each client has a separate, locked storage area. No other account can list, open or download your files.
Encrypted
Files are encrypted in transit and at rest, on Amazon Web Services in Sydney, Australia.
One machine per analysis
Every analysis runs on its own fresh computer, which is deleted as soon as the job ends.
Deleted on schedule
Uploads and results are removed automatically after 180 days. Download what you need to keep.